Why Trade Your Thrift Savings

The stock market alternates between secular bull markets and secular bear markets. During bull markets, buy-and-hold works well. During bear markets and extended trading zones, it doesn't, and that's exactly when actively managing your TSP funds makes the difference.

History

During the early 1980s and '90s, the buy-and-hold strategy of investing was a great way to build your savings since equities were in a secular bull market. Then for a decade and a half, market dynamics changed as the stock market was trapped within a secular bear market, making buy-and-hold a poor method of building your retirement savings.

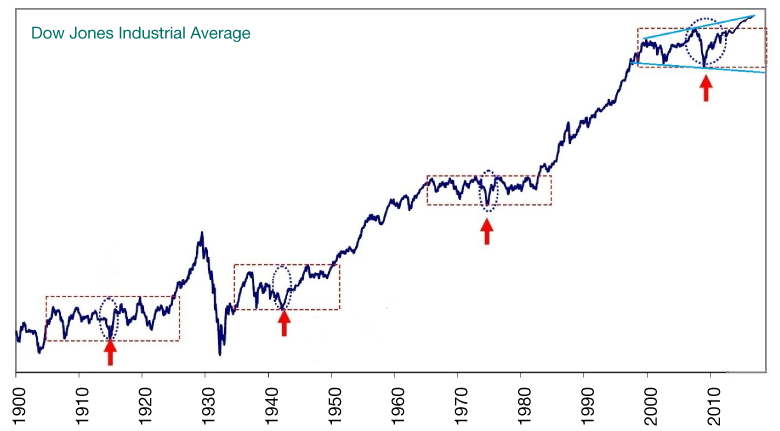
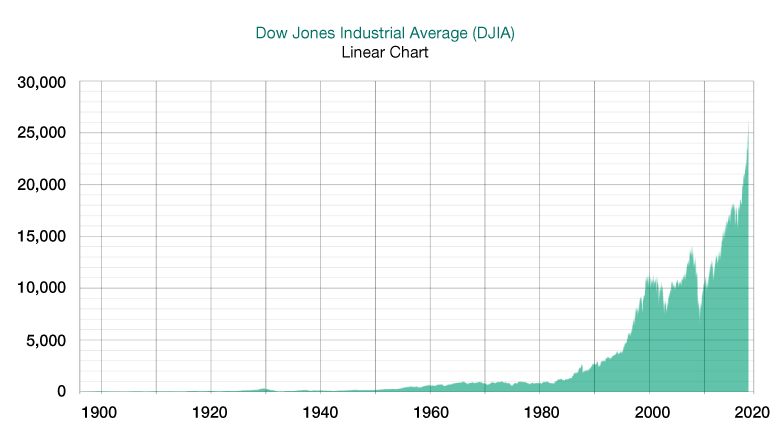
To start, let's take historical data and construct a yearly linear chart of the Dow Jones Industrial Average (DJIA) all the way back to the beginning of the 20th Century up to year 2004. Looking at this chart, we see the stock market surging higher ever since the early 1980s. On a linear scale, the early history appears nearly flat, but it was not. The market had a long history of painful times as well as prosperous times.

dow jones
dow jones
Dow Jones Industrial Average (DJIA) — Linear Chart

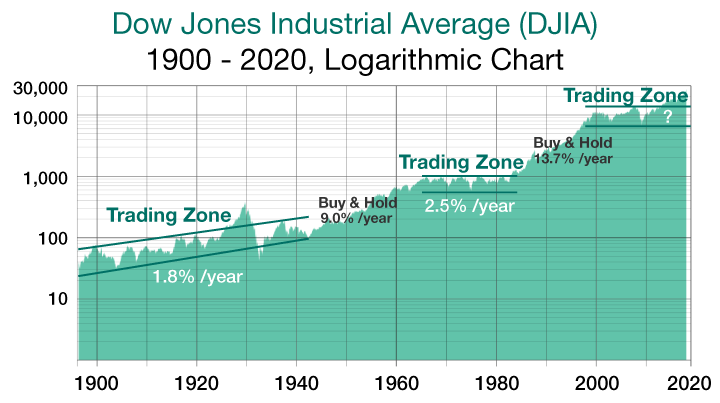
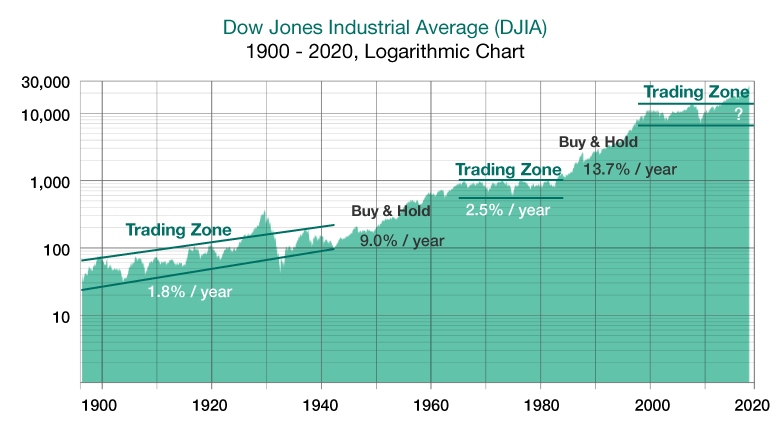
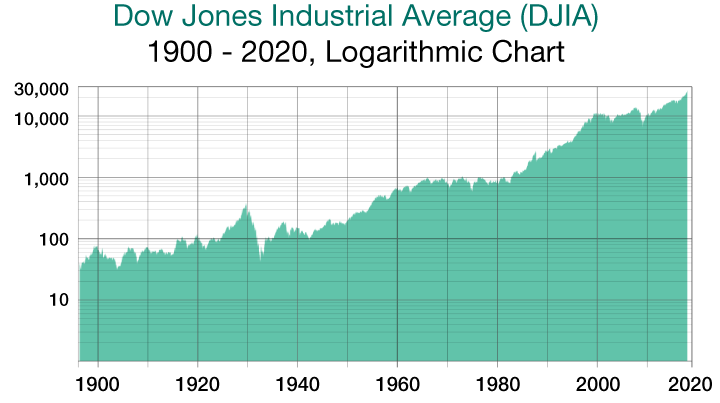
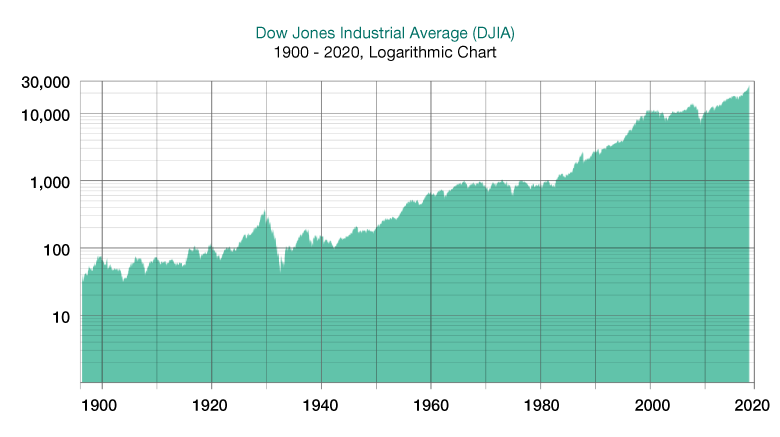
When we reconstruct the above data into a yearly logarithmic chart, important patterns become far more apparent. Percentage charts work just as well to accurately present stock history.

dow jones
dow jones
Dow Jones Industrial Average (DJIA) — 1900–2020, Logarithmic Chart

Market Periods

Annotating this chart reveals a clear pattern: alternating periods of stagnation and growth. The bad times were those when the market was caught in a long-term trading zone, where buy-and-hold produced next to nothing. The good times were uptrending markets where it was advantageous to stay fully invested and let the gains compound.

dow jones
dow jones
Dow Jones Industrial Average (DJIA) — 1900–2020, Logarithmic Chart (Annotated)
(Updated Dow Jones chart below.)
dow jones
dow jones
Dow Jones Industrial Average — Historical

Trading Zones

Two especially devastating periods stand out. The first was during the Great Depression, when there was a significant drop in the market from September 1929 through July 1932. The Dow lost 90% of its value. Another painful period was the collapse of 1973–1974. One may ask: what about the crash of 1987? The chart is a yearly chart using only one data point per year (the closing value of the last trading day). Because the chart plots only year-end values, this crash doesn't appear. The market recovered enough to close December 1987 higher than it opened in January. Unbelievably, 1987 was a profitable year, which is why the crash doesn't appear on the chart.

Were there other bad times? Yes. Looking at the history of the market, we see periods when it was essentially flat for many years, even decades. We label these "Trading Zones." During these times, anyone invested in mutual funds or blue chip growth stocks would have seen negligible growth over very long periods of time.

How long are we talking? From 1900 through 1941, the Dow Jones increased at only about 1.8% per year. Another stagnant period ran from roughly 1963 through 1982 (20 years), with the Dow returning only about 2.5% per year. These are the dangers of buy-and-hold investing.

The next trading zone ran from 2000 to 2014. During this secular bear market there were many bull and bear cycles: a bear cycle from 2000 to 2002, a bull cycle from 2002 to 2007, then another grueling bear from 2007–2009 (where the S&P crashed 57%). During a secular bear market, it is critical to trade accounts in order to protect capital during downturns and continue to outperform buy-and-hold across both bull and bear cycles. In 2014, the market broke out above the uptrending boundary of this expanding zone.

dow jones
dow jones
Dow Jones Industrial Average ($INDU) — May 2020

Secular Bull Markets

There were two intervals when the buy-and-hold strategy worked rather nicely. One was from about 1942 through 1962 (20 years), when the DJIA returned about 9.0% per year, and another from 1983 to March 2000 (roughly 18 years), returning 13.7% per year. Those were excellent times to ride the mutual fund wave.

The market then entered the next bull cycle beginning in March 2009. Buy-and-hold is a valid approach only during secular bull markets, when it's wise to be heavily invested in the stock funds. Even so, secular bull markets contain periods of high risk, volatility, and pullbacks. This is precisely when our methodology shines, allocating into stock funds at the right times to achieve the highest reward with the lowest risk.

Where Are We Now?

The secular bull market that began in March 2009 has shown remarkable resilience, but it hasn't been without turbulence. Sharp corrections — including a ~34% drop during the COVID crash of 2020 and a ~25% decline in the S&P 500 during 2022 — have tested buy-and-hold investors along the way. Each of these episodes reinforced a core principle: even in bull markets, there are moments when protecting capital matters just as much as pursuing gains.

Today, markets continue to push higher amid strong corporate earnings and ongoing investment in transformative technologies. At the same time, elevated valuations, geopolitical uncertainty, and shifting Federal Reserve policy mean the risk environment is never static. The cycle will turn again. It always does. The question is whether your TSP will be positioned for it.

Our Goal

Whether markets are trending strongly higher or grinding through a prolonged sideways period, ThriftTrading's methodology is built to navigate both. We don't try to predict the future. We respond to what the market is telling us, one allocation decision at a time. Our subscribers don't need to monitor the markets themselves. That's what we do.